US Iran War and Nifty: What Every Indian Options Trader Must Know Right Now
It was a normal Thursday evening on 27 February. By the time Indian markets opened on Monday, Nifty had already lost 750 points in overnight futures. The rupee was at ₹92. Brent was up 12% in 48 hours. And your option premiums had quietly become 40% more expensive. While you were sleeping. Here's what is actually going on, and what it means for your trades.
How the US Iran War Actually Started
People keep saying this came out of nowhere. It didn't. The warning signs were sitting right there for anyone watching. What changed on 28 February wasn't the situation. It was that the situation finally became impossible to ignore.
Here's the sequence that brought us here.
Protests break out in more than 100 Iranian cities, the biggest unrest since the 1979 revolution. The Iranian rial has essentially collapsed. People are angry, hungry, and publicly calling for regime change. The government responds with force, killing thousands. The world watches. Oil markets begin quietly pricing in instability.
During his State of the Union address, Trump publicly accuses Iran of restarting its nuclear weapons program. He says Iran has missiles capable of reaching US bases and Europe. For the first time, traders stop treating military action as a tail risk and start treating it as a real possibility. Oil starts climbing. Gold follows.
US and Israeli forces launch coordinated air strikes across Tehran, Isfahan, and other cities. Iran's Supreme Leader Ayatollah Khamenei is killed on day one. Brent crude surges 12% in 48 hours, the sharpest two-day oil move since 2020. Global markets go into shock. Nifty futures, trading overnight, begin to collapse.
Iran fires hundreds of missiles and drones at Israel and at US military bases across Saudi Arabia, the UAE, Kuwait, and Bahrain. Dubai is struck. The Strait of Hormuz, the narrow channel through which roughly 20% of the world's seaborne oil passes, nearly shuts down. India is closed for Holi on 3 March. When we reopen on 4 March, it is a bloodbath.
Tehran is still being bombed. Iran is retaliating daily. Trump says the war will last another four to five weeks. Brent crude is sitting above $87. FIIs have pulled ₹21,831 crore out of Indian equities in a single week. Nifty futures are trading around 24,300 as this article goes out.
We have been through this before. Hamas in 2023, various Iran-related scares going back years. Every time, traders panicked, markets dipped, and things recovered. This one is different in scale. Iran's Supreme Leader is dead. The Strait of Hormuz is actively disrupted. Gulf nations hosting US military bases are being struck directly. The oil supply chain that India depends on is sitting inside an active war zone. Not near it.
Why India Gets Hit Harder Than Most Countries
Two global banks, Goldman Sachs and Societe Generale, have specifically named India as one of the economies "most at risk" from this conflict. That's not dramatic language. It's an accurate description of our structural exposure.
The short version: India imports nearly 85–90% of its crude oil. We consume 5.6 million barrels a day. About 40% of that comes through the Strait of Hormuz, the exact shipping lane that Iran just disrupted. When that lane gets choked, everything downstream gets expensive.
"A 20% rise in Brent crude wipes roughly 2% off Indian corporate earnings, according to Goldman Sachs estimates. That is why India is being called 'most at risk' in Asia. Not as hyperbole. Just arithmetic."
The mechanism works in three steps, and each step makes the next one worse.
Step one: The import bill balloons
When Brent crude rises $15–20 per barrel and stays there, India's annual oil import bill increases by tens of billions of dollars. That money is flowing out. It widens our Current Account Deficit, which was already under pressure before this war started.
Step two: The rupee falls
More oil imports means more demand for US dollars to pay for them. More dollar demand means the rupee weakens. We have already seen it break ₹92 per dollar, a record low. A weaker rupee, in turn, makes every other import more expensive. Which leads directly to step three.
Step three: Inflation rises, margins get squeezed, stocks fall
Costlier petrol, diesel, LPG, plastics, chemicals: everything with oil in the supply chain gets more expensive. Almost every listed company has some exposure to these costs. Earnings expectations get revised down. That is the exact chain of events dragging Nifty lower right now. It's not irrational panic. It's basic arithmetic working against us.
India currently holds about 25 days of crude oil stock and 25 days of petroleum products inventory. The government says supplies are adequate. That's probably true in the short term. But if the Strait of Hormuz stays disrupted for several more weeks, that buffer shrinks, and analysts will start pricing in potential fuel price hikes, which is a whole new problem for inflation.
See How a VIX Spike Destroys Option Premiums. Without Risking Real Money.
NiftyPro's free simulator lets you trade through historical volatility events: previous oil spikes, election results, Budget Day. Watch how your P&L changes when VIX moves. ₹10 lakh virtual capital. Zero risk.
Launch Free Simulator →The Damage to Nifty, Session by Session
Let's look at what actually happened in the market, day by day. Not the headline number. The mechanics of how each session moved, and why. This matters because the pattern of how markets fall tells you a lot about what comes next.
| Date | Nifty 50 (approx.) | Move | What drove it |
|---|---|---|---|
| 27 Feb (Fri) | 25,550 | −250 pts | FIIs begin selling ahead of the weekend; war fears price in slowly |
| 2 Mar (Mon) | 25,050 | −500 pts | US–Israel strikes confirmed; Brent +12% in two days; market gaps down at open |
| 4 Mar (Wed)* | 24,365 | −685 pts | Post-Holi reopening absorbs two days of war developments at once; Hormuz fears peak |
| 5 Mar (Thu) | 24,765 | +400 pts | Short covering; Trump hints war will be short; traders buy the dip |
| 6 Mar (Fri) | 24,450 | −315 pts | Crude pushes above $87; Hormuz near-shutdown confirmed; dip buyers exit |
| 9 Mar (Mon, futures) | ~24,300 | −274 pts est. | War enters week two; no ceasefire signal; FII selling continues |
*The Holi holiday on 3 March meant India's reaction to two days of war news was compressed into one session on 4 March, which is why that single-day drop was so steep.
In total: Nifty has fallen from roughly 25,550 to approximately 24,300 in under five trading sessions. The Sensex shed 1,745 points on 4 March alone. Foreign investors pulled out ₹21,831 crore from Indian equities in a single week, one of the largest weekly FII outflows in recent memory. L&T fell 7.5% in one session because of concerns about its infrastructure order book exposure across the Gulf.
The 400-point bounce on 5 March is worth noting specifically. Markets don't fall in straight lines. That recovery was driven by short covering and by traders who thought Trump's "4–5 weeks" comment was a green light to buy. By Friday, those same traders were selling again. A bounce inside a downtrend is not a trend reversal. Right now we are still in the downtrend.
What India VIX Spiking 62% Actually Means for Your Options
Most retail traders watch Nifty's price level and nothing else during a crash. That's understandable. But if you are an options trader, the more important number right now is not where Nifty is. It's what India VIX is doing.
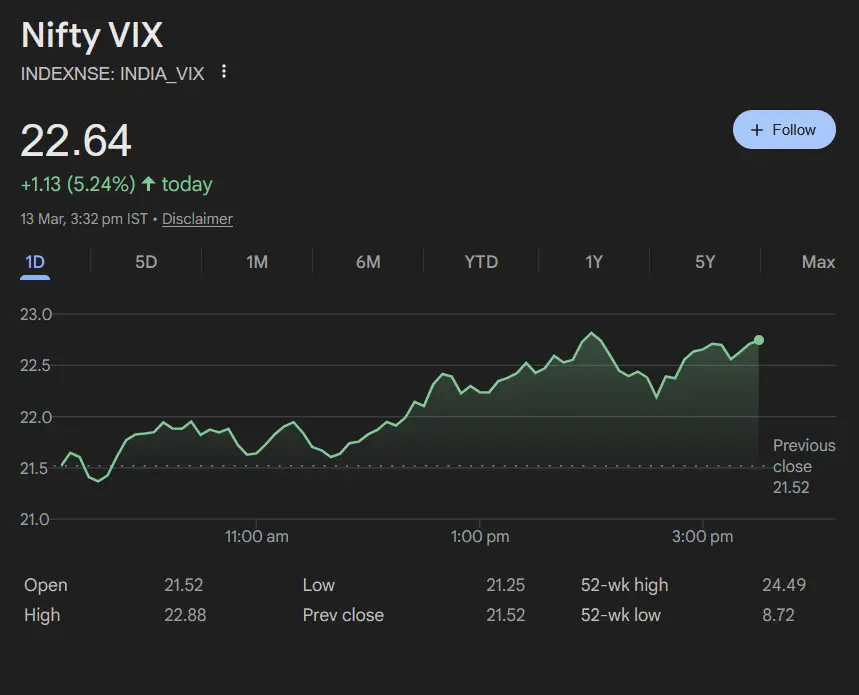
India VIX is the volatility index. Think of it as Dalal Street's fear gauge. When VIX is low, say below 12, the market is calm, and option premiums are relatively cheap. When VIX spikes, it means traders are pricing in bigger, faster moves. And option premiums move up with it.
During this conflict, India VIX rose 62% over two sessions, jumping from below 12 to above 18. It is up 119% year-to-date. That number has a direct, mechanical impact on every options position you are holding or thinking about entering.
If you are buying options right now
When VIX was at 12, a typical Nifty weekly ATM straddle would cost you around ₹250–300. At VIX 18+, that same straddle is ₹400–450 or higher. You are paying 40–50% more for exactly the same directional bet. And here's the painful part: if you are right about direction but VIX normalises while you wait, what traders call IV crush eats your profits. You can be correct about where Nifty is headed and still lose money on your options. I've seen it happen to people who had the right read on direction but forgot to account for elevated implied volatility. It's a brutal lesson to learn in real money.
If you are selling options right now
The premium looks fat. And it is. Sellers are collecting significantly more than they were a month ago. The problem is gap risk. That 685-point single-session drop on 4 March can obliterate weeks of premium collection instantly. Selling options into high VIX feels good until it doesn't. The premium is fat because the market is pricing in exactly that kind of gap move happening again.
They cut position size. They favour strategies that work with elevated volatility rather than against it: Iron Condors when VIX is high but range-bound, calendar spreads to play VIX normalisation. And honestly? Sometimes the best trade is no trade at all. Sitting in cash and waiting for VIX to drop back toward 12–14 is a valid strategy. It just doesn't feel heroic.
Which Sectors Are Getting Hit, and Which Aren't
Not every stock in Nifty responds the same way to an oil shock. Even inside a broad market sell-off, money rotates. Understanding where it's rotating from and to is one of the more useful things you can do right now.
The most striking individual move was L&T, which fell 7.5% in a single session. The market is pricing in risk to L&T's large infrastructure order book across the Gulf region. Companies with significant Middle East business exposure, contracts, projects, revenues, have generally been the hardest hit beyond the index-level falls.
Three Scenarios: Where Does Nifty Go From Here
Nobody knows how this ends. Anyone who tells you otherwise is guessing, including the institutional desks, the TV analysts, and the Telegram group admins. What you can do is think in scenarios. Not "what will happen," but "what are the plausible outcomes, and how does each one affect my positions?" Here is the framework most professional desks are working with right now.
| Scenario | What It Looks Like | Nifty Outlook | Crude Oil |
|---|---|---|---|
| 🕊️ Short War Base case |
War ends in 4–5 weeks as Trump suggested; ceasefire holds; Hormuz shipping slowly resumes | Sharp recovery toward 25,500–26,000. History is strongly in Nifty's favour after short geopolitical shocks. | Falls back toward $70–75 |
| 😰 Prolonged Conflict Possible |
War drags past six weeks; Hormuz stays partly closed; more Gulf nations get drawn in | Continued pressure; Nifty likely tests 23,500–24,000; sustained FII selling; inflation fears deepen | Sustains at $90–100 |
| 💀 Worst Case Low probability |
Wider regional escalation; oil infrastructure directly attacked; global supply shock | Sharp crash toward 22,000–22,500; extreme VIX spike; tail-risk territory | $110–130+ possible |
Emkay Global studied previous events: after the October 2023 Israel-Hamas escalation, Nifty gained 10.5% over the following three months. After the June 2025 Iran-related flare-up, it gained 2.2% over the same period. The Russia-Ukraine invasion in February 2022 caused a 3% fall in week one and kept markets subdued for about three months. The pattern is consistent: the shorter and more contained the conflict, the faster Nifty recovers.
The single number to watch is the Strait of Hormuz. Not Trump's statements. Not Nifty's opening level. If shipping through the Strait normalises, oil falls, the rupee stabilises, FIIs come back, and a sharp recovery follows quickly. Set a news alert for it today. That one variable will tell you more about where Nifty goes next than anything else you track.
Practice Trading Through a High-VIX Market Before the Next Shock Hits
NiftyPro's free simulator lets you trade through historical crash scenarios. Watch how Delta, Theta, and Vega behave when VIX spikes. Build hedged positions and see P&L move in real time. ₹10 lakh virtual capital. Zero risk.
Try It Free →What to Actually Do as a Nifty Options Trader Right Now
NiftyPro is an educational platform, not a SEBI-registered adviser. Nothing here is a trading recommendation. But let me share what experienced traders actually do in environments like this one, because it is probably the opposite of what your instincts are telling you.
Stop reacting to news that is already old
The gap-down on 2 March and the bloodbath on 4 March: the market was already pricing in the shock. By the time you read a headline and think about entering a trade, that news is already several hours old. Markets move on anticipation, not confirmation. If you are reading about the war and thinking "should I buy puts now?", you are already late. The market priced that in while you were reading about it.
Understand what you are actually paying for premium right now
With VIX above 18, every option you buy carries significantly elevated implied volatility baked into the price. When VIX normalises, and it always does eventually, that premium compresses. This is called IV crush. Even if Nifty moves exactly where you expected, an IV crush can wipe out your gains. I've watched traders nail the direction perfectly and still end up flat or negative on their options because they didn't account for this. Factor it in before every entry.
Track three numbers every morning, not just Nifty's price
The three things that actually matter right now: Brent crude (above $90 sustained means more pain ahead for India); FII daily flow data (persistent selling means continued index pressure); Strait of Hormuz shipping updates (this is the real signal for when things normalise). TV commentary, Telegram calls, social media takes: all noise right now.
Cut your position size. Seriously.
This is the least exciting advice and also the most important one. In volatile markets, professional traders typically reduce position size by 30–50% compared to what they'd run in normal conditions. You can be directionally correct and still blow up a position if a single gap-down move catches you oversized. In a market like this, the goal is to survive. Profits come after. You cannot trade next week if you are wiped out today.
🎯 The short version: US Iran War and what it means for Nifty
- The US Iran war began 28 February 2026. Khamenei was killed on day one. The Strait of Hormuz, through which roughly 40% of India's crude passes, is near-disrupted.
- India is one of the most exposed economies in Asia because of our structural dependence on Middle East oil. Higher oil = bigger import bill = weaker rupee = inflation = lower corporate earnings = Nifty falls. That's not fear. That's arithmetic.
- Nifty has lost 1,100+ points in five sessions. India VIX has gone from below 12 to above 18. Option premiums are 40–50% more expensive than they were a month ago.
- Under pressure right now: Aviation, OMCs, Paints, Autos. Relatively safer: IT, Defence, Upstream Oil, Pharma. L&T fell 7.5% in a single session on Gulf exposure concerns.
- History says short geopolitical shocks lead to fast recoveries. Watch the Strait of Hormuz. When shipping normalises, oil falls, and Nifty tends to bounce sharply.
- In high-VIX environments: cut position size, account for IV crush on any options you buy, track crude and FII flows every morning before making decisions.
- Sometimes the best trade is no trade at all. Patience is a strategy, not a cop-out.
Questions People Are Asking About the US Iran War and Nifty
Why is Nifty falling because of a war in the Middle East?
It comes down to oil. India imports nearly 85–90% of its crude, with around 40% passing through the Strait of Hormuz. The US Iran war has pushed Brent crude up over 15% and disrupted that shipping lane. Higher oil raises our import bill, weakens the rupee, pushes up inflation, and squeezes corporate margins, all of which feed into lower stock prices. Add large-scale FII selling on top, and you get what Nifty has done over the past week.
What is India VIX and why does it keep coming up in every market discussion right now?
India VIX is the volatility index, essentially a measure of how much fear and uncertainty options traders are pricing into the market over the next 30 days. When VIX is low, the market is calm and options are relatively cheap. During this conflict, VIX jumped 62% over two sessions, going from below 12 to above 18. That matters because it directly affects option pricing. Premiums are now 40–50% more expensive than they were before the war started.
Which Indian sectors should I be watching most closely right now?
The ones taking the most direct damage are aviation, paints and chemicals, oil marketing companies like HPCL and BPCL, and automobiles. These are all either directly dependent on crude prices or face demand slowdowns as costs rise. On the other side, IT companies benefit from rupee weakness since they earn in USD. Defence, upstream oil producers like ONGC, and pharma are also holding up relatively better.
How long is this going to affect Indian markets?
The honest answer is we don't know. What history does tell us: after the October 2023 Israel-Hamas escalation, Nifty was up 10.5% over the three months that followed. After a June 2025 Iran-related flare-up, it was up 2.2%. Short conflicts tend to lead to fast recoveries. The key variable is the Strait of Hormuz. Once shipping through it normalises, oil prices tend to fall and markets tend to bounce hard.
Should I be buying puts to hedge my portfolio during the Iran war?
NiftyPro is not a SEBI-registered investment adviser and this is not trading advice. What we can say: with VIX above 18, put options are significantly more expensive than normal. Any hedging decision needs to account for elevated implied volatility and the possibility of IV crush if the conflict de-escalates quickly. Please speak to a SEBI-registered adviser before making hedging decisions.
This article represents the personal opinions and analysis of the NiftyPro editorial team. It is not investment advice, a trading recommendation, or financial guidance of any kind.
We have tried to be accurate, but this article may contain errors, omissions, or data that has changed since publication. Market conditions and geopolitical situations move fast. Please verify independently before acting on anything here.
NiftyPro is not registered with SEBI as an Investment Adviser, Research Analyst, or Stockbroker. All figures are approximate and sourced from publicly available information as of 8 March 2026. Past performance, simulated or actual, is not indicative of future results.
Options trading carries substantial risk of loss. As per SEBI's study on the equity F&O segment (FY 2021–22): 9 out of 10 individual traders in the equity F&O segment incurred net losses. Please consult a SEBI-registered Investment Adviser before making any investment or trading decisions. Visit sebi.gov.in for a list of registered advisers.