US Iran War and Oil: Should Indian Traders Be Worried?
Brent crude has already touched $119.50 a barrel during this war. It crashed back to $80, then bounced above $90, all within 48 hours. LPG cylinders are running short in Delhi, Mumbai, Kolkata, and Bengaluru. Restaurants are shutting down. The Strait of Hormuz, the narrow waterway that carries 20% of the world's oil, is effectively closed. Today is Day 12 of the US Iran war. Here is exactly what is happening to oil, what it means for India, and what options traders need to understand before they put on a single trade.
In This Article
What the Strait of Hormuz Closure Actually Means
Let's start with the one fact that makes this oil crisis unlike anything we've seen since the 1970s. The Strait of Hormuz, the narrow 33-kilometre-wide channel between Iran and Oman, is the single most important oil chokepoint on the planet. About 20% of the world's entire oil supply passes through it every day. There is no practical alternative route for most of that volume.
Since the US and Israel began strikes on Iran on 28 February, that waterway has essentially stopped functioning.
Here is exactly what has happened to it, day by day, because the details matter for understanding where oil prices go next.
28
2–4
8–9
11
Why Oil Prices Are Moving 17% in a Single Day
If you've been watching crude prices this past week and thought "this makes no sense," you're not wrong. Let's lay out exactly what has happened, with real numbers, because the volatility itself tells you something important about where oil goes from here.
| Date | Brent Crude (approx.) | Move | What caused it |
|---|---|---|---|
| Feb 27 (pre-war) | $71/bbl | Baseline | Normal pre-conflict level; EIA confirmed this figure |
| Mar 2–3 | $80–85/bbl | +13–20% | US–Israel strikes confirmed; Hormuz tanker freeze begins |
| Mar 8–9 (intraday peak) | $119.50/bbl | +68% from baseline | Gulf producers cut output; Aramco warns of catastrophic consequences; Brent hits $103–104 on close |
| Mar 10 (intraday swing) | $80 → back to $90 | −17%, then +13% | Energy Sec. Wright's false Navy escort post; then retraction |
| Mar 11 (today) | ~$90–91/bbl | Stabilising | IEA announces 400M barrel reserve release; market digesting |
The US Energy Information Administration has revised its full-year 2026 Brent forecast from $57.69 per barrel (its February estimate) to $78.84 per barrel. That is a massive upward revision in one month. For Q2 2026, the EIA expects Brent to average $91 per barrel. Analysts at Rystad Energy say if the current situation lasts two months, Brent tops $110. If it lasts four months, $135 per barrel is possible.
"Policy measures may have limited impact on oil prices unless safe passage through the Strait of Hormuz is assured." Source: JPMorgan Chase commodities analysts, March 10, 2026
Trade Through an Oil Shock. With Zero Real Money at Risk.
NiftyPro's free simulator lets you test your Nifty options strategy through historical oil shocks and volatility spikes. ₹10 lakh virtual capital. See exactly how your P&L would have moved.
Launch Free Simulator →India's Specific Exposure: Oil, LPG, and the Rupee
India imports 88% of its crude oil. That single number explains almost everything about why this war matters so much for our economy and our markets. Let's go through each layer of the problem, because they are hitting us in three separate ways at the same time.
Layer 1: Crude oil supply disruption
More than 40% of India's crude imports transit the Strait of Hormuz. In recent months, India had also been reducing Russian oil purchases and increasing sourcing from West Asia, lifting our Gulf dependence to nearly 50% of total crude imports. The timing is brutal. India holds roughly 25–40 days of crude and refined fuel stock according to government figures. Ships that had already crossed the Strait before the war began are still arriving and covering immediate demand. But if the closure extends past four to six weeks, refineries will need to start rationing.
Layer 2: The LPG and LNG crisis is already here
This is the part of the story that hasn't made it into most trading discussions. India imports approximately 50% of its natural gas as LNG, with around 80% of that LNG coming from West Asia, mostly Qatar. Qatar lies on the far side of the Hormuz chokepoint and has been unable to dispatch a single cargo since the war began. The result, as of today, March 11: LPG cylinder shortages are being reported across Kolkata, Chennai, Bengaluru, Hyderabad, Coimbatore, and Visakhapatnam. Restaurants in multiple cities have shut down or reduced menus. Delhi High Court's canteen stopped serving main course meals because of the gas shortage. The government has reshuffled gas allocation priority, putting LPG, CNG, and piped cooking gas at the top.
Layer 3: The rupee and the current account
India pays for crude in US dollars. When the import bill rises sharply because of higher oil prices, demand for dollars increases, and the rupee weakens in response. The rupee had already breached ₹92 per dollar before this article. HDFC Bank's economists estimated that a sustained $10 per barrel increase in crude widens India's Current Account Deficit by 40 to 50 basis points. Crude has gone up more than $30 per barrel since the war started. The CAD pressure is significant. A weaker rupee, in turn, makes every other import more expensive, adding a second layer of inflationary pressure on top of the direct fuel impact.
Will Petrol and Diesel Prices Rise in India?
This is the question everyone is asking, so let me give you a direct answer instead of the usual "it depends." The current situation is this: petrol and diesel prices in India have not been officially revised yet. As of March 9–10, Delhi petrol is at ₹94.77 per litre, Mumbai at ₹103.49 per litre, Hyderabad at ₹107.45–107.50 per litre, and Kolkata at ₹104.99 per litre. These rates were unchanged as of the last official update.
But that stability is artificial, and it has a timer on it.
Why prices haven't risen yet
When crude was hovering around ₹60–62 per barrel earlier, Oil Marketing Companies like HPCL, BPCL, and IOC were building up a buffer margin. The government also has fiscal headroom. The government can reduce central excise duty on petrol and diesel to absorb crude price increases, and has done this before during oil shocks. Debashish Mishra of Deloitte South Asia, speaking to The Federal, estimated the government can absorb a ₹10–₹15 per litre increase without inflation going out of control, using tax cuts as a buffer.
When prices will likely rise
If Brent sustains above $90–100 per barrel for more than three to four weeks, the buffer disappears. The government will not be able to absorb the full difference between international crude prices and domestic pump prices without either raising taxes elsewhere or letting fuel prices rise. Experts cited in reporting have estimated domestic LPG cylinders could rise by ₹50–₹150 per cylinder if global gas prices remain elevated. Petrol and diesel could follow if crude stays above $100 for an extended period.
Three Oil Price Scenarios for the Next 4–8 Weeks
Nobody knows how this ends. But you can build a framework of plausible outcomes and their likely oil price consequences. Here is what the major analysts and institutions are currently working with, as of Day 12.
| Scenario | What it requires | Brent crude likely range | India impact |
|---|---|---|---|
| 🕊️ Short War Weeks, not months |
Ceasefire within 2–3 weeks; Hormuz shipping resumes; mines cleared; war insurance restored | $70–80/bbl back near pre-war levels |
Rupee recovers. No pump price hike needed. LPG supply resumes. Market rallies sharply. |
| 😰 Prolonged Conflict 6–10 weeks |
War drags; Hormuz stays partly closed; Iraq and Kuwait production shut-ins deepen; IEA reserves partially offset | $90–110/bbl sustained elevated |
Pump price hike likely. LPG/LNG shortage deepens. Rupee stays above ₹92. CAD widens. Inflation uptick of 0.3–0.5%. |
| 💀 Extended Disruption 3–4+ months |
No ceasefire; Saudi Arabia and UAE storage full; major production shut-ins across the Gulf; IEA reserves depleted | $130–135/bbl (Rystad projection) |
Severe fuel price hike unavoidable. Deep LPG/LNG crisis. Rupee under sustained pressure. Inflation spike. Significant drag on GDP. |
The analyst consensus, if you average across JPMorgan, Rystad, Ninety One, ExxonMobil's chief economist, and Rapidan Energy, is roughly this: the war has caused the biggest oil supply disruption in history. Even in the optimistic scenario where the Strait reopens in 2–3 weeks, oil prices are unlikely to return to the $60–70 range seen before the war. The risk premium is here for a while.
What This Means for Nifty Options Traders Specifically
All of the above is context. This section is the part that matters for your actual positions. Let me translate the oil story into its options trading implications directly.
Oil and Nifty don't always move in the same direction
When oil spikes because of a supply shock, Nifty tends to fall. When oil spikes because of strong global demand, Nifty can actually rise alongside it. The current situation is a supply shock. That is categorically negative for an oil-importing economy like India. But once a ceasefire scenario starts being priced in, oil will fall sharply and Nifty will likely spike hard in the opposite direction. The trap for traders is being positioned for continued pain at exactly the moment a peace signal comes.
Brent above $90 sustained is the threshold to watch for Nifty
Goldman Sachs has estimated that every 20% rise in Brent crude cuts Indian corporate earnings by roughly 2%. Brent is currently around 47% above its pre-war level of $71. If sustained, that is a meaningful drag on Nifty's earnings multiple. Watch the $90–100 zone on Brent carefully. Stabilisation below $90 is likely a recovery signal for Nifty. A breakout above $100 sustained is a further downside signal for the index.
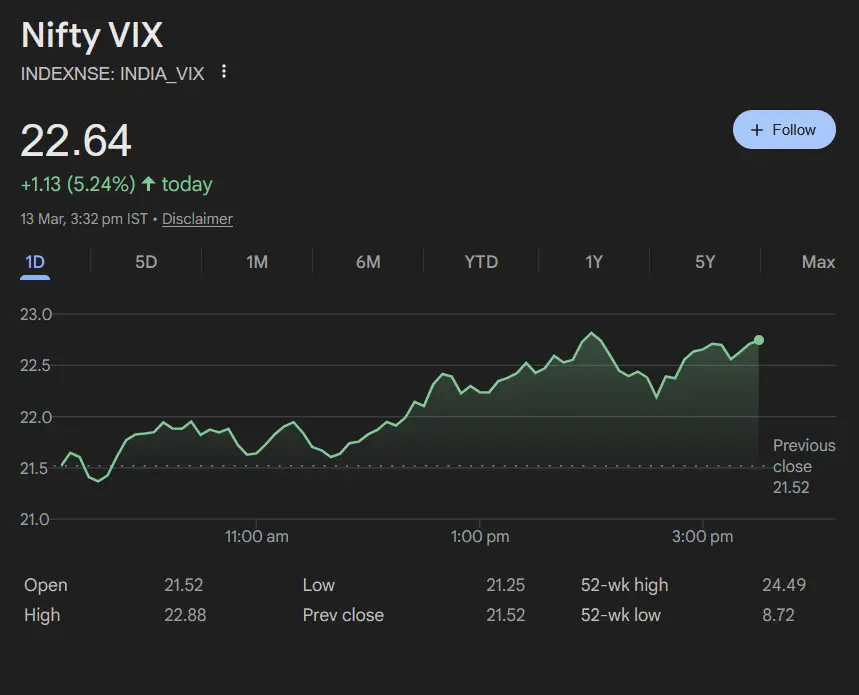
VIX and oil volatility are moving together right now
Oil's 17% single-day swings are being reflected in India VIX's elevated readings. Both are responding to the same uncertainty: how long does the Hormuz closure last? As long as the war continues with no clear end signal, both oil and VIX will stay elevated and erratic. This is not a normal trending market. It is an event-driven market where a single tweet moved oil by 17%. Position size accordingly.
The IEA reserve release buys weeks, not months
The 400 million barrel emergency release announced today is historically significant. But energy market analyst Sasha Foss of Marex told CNBC it essentially buys "a few days" in terms of market stability. The structural problem, a closed Hormuz with Gulf producers cutting output, is not solved by reserve releases. It is only solved by the war ending and shipping resuming. Keep that in perspective when you see oil fall on IEA news.
🎯 The short version: US Iran War, oil, and what Indian traders need to know
- Brent crude went from $71 before the war to $119.50 intraday on March 9. It has since pulled back to around $90–91. That is still 30%+ above pre-war levels.
- The Strait of Hormuz, through which 20% of world oil and 40%+ of India's crude passes, has been effectively closed since February 28. Iran has mined it. Commercial insurance is unavailable. Traffic is near zero.
- The IEA announced the largest emergency oil reserve release in history (400 million barrels) on March 11. This stabilises prices for days to weeks, not months.
- India's LPG and LNG supply is already disrupted. Shortages are live across Kolkata, Chennai, Bengaluru, Hyderabad, Coimbatore, and Visakhapatnam as of today.
- Domestic petrol and diesel prices have not been revised yet. The government has buffer room through excise duty cuts. That buffer disappears if crude stays above $90–100 for 4+ weeks.
- For Nifty options: watch Brent's $90–100 zone, watch the Strait of Hormuz for any ceasefire signal, and keep position size small. In this market, 17% oil moves in a day mean Nifty gap risk is real and constant.
- The EIA's base case: Brent averages $91 in Q2 2026, then falls to $70 by Q4 if Hormuz reopens. Rystad's worst case: $135/bbl if disruption lasts four months.
Practice Options Trading in a High-Oil, High-VIX Market. For Free.
NiftyPro's simulator lets you trade through historical oil shock and volatility scenarios with ₹10 lakh virtual capital. No real money. No risk. See exactly how your strategies perform when crude moves like this.
Try the Simulator Free →Frequently Asked Questions
Is the Strait of Hormuz actually closed or just disrupted?
Effectively closed to commercial traffic, as of March 11. Iran has laid mines, the IRGC has fired on vessels, and commercial war risk insurance is unavailable for any tanker attempting transit. The US military has escorted no vessel through the Strait as of today, despite an incorrect claim by the US Energy Secretary that was retracted within minutes. Physically the waterway exists, but commercially it is non-functional.
How long can India manage without new crude imports through Hormuz?
Government sources have indicated India holds around 25–40 days of crude oil and refined fuel stock. Shipments that crossed the Strait before the war are still arriving and are expected to cover domestic demand for approximately 40–45 days from the war's start date of February 28. If the closure extends beyond mid-April without alternative sourcing being arranged, India will face supply pressure. The government is already exploring alternative crude sources.
Why did oil fall 17% in one day if the crisis is still ongoing?
Oil markets are pricing two competing scenarios simultaneously. The physical disruption (Hormuz closed, Gulf producers cutting output) is extremely bullish for oil. But traders are also pricing in the belief that the US will eventually force the Strait open, and that the war will be short. Every signal of a potential ceasefire or Hormuz reopening triggers sharp selling. The Energy Secretary's incorrect tweet about Navy escort of a tanker briefly convinced the market the Strait had reopened. When it was retracted, prices rebounded. This is the pattern you will see until the war ends.
What is India's government doing to manage the oil impact?
The government has reshuffled domestic gas allocation priority, putting LPG, CNG, and piped cooking gas at the top. It has confirmed crude and fuel stocks are adequate in the near term. It is exploring alternative crude import sources. PM Modi has publicly assured the safety of Indians working in Gulf countries. The government has not announced any petrol or diesel price revision, and has fiscal headroom through excise duty adjustments to delay retail price hikes if crude stabilises.
Will this affect the Nifty 50 more than what we have already seen?
That depends entirely on the war's duration. In the short-conflict scenario, Nifty likely recovers sharply as oil falls and FIIs return. In the prolonged scenario, sustained crude above $100 widens the current account deficit, keeps the rupee weak, pressures corporate earnings, and keeps Nifty under downward pressure. The index has already lost over 1,100 points. Further downside depends on whether the IEA release and Trump's "ending soon" signals translate into an actual ceasefire. Until that happens, elevated VIX and oil volatility are the trading environment.
⚠️ Disclaimer: Please Read. This article represents the personal opinions and analysis of the NiftyPro editorial team based on publicly available information as of 11 March 2026 (Day 12 of the US Iran war). It is not investment advice, a trading recommendation, or financial guidance of any kind. Oil prices, geopolitical situations, and market conditions are moving extremely rapidly. Data cited here may have changed materially by the time you read this. Please verify all figures independently before acting. NiftyPro is not registered with SEBI as an Investment Adviser, Research Analyst, or Stockbroker. All price figures are approximate. Past performance, simulated or actual, is not indicative of future results. Options trading carries substantial risk of loss. As per SEBI's study on the equity F&O segment (FY 2021–22): 9 out of 10 individual traders in the equity F&O segment incurred net losses. Please consult a SEBI-registered Investment Adviser before making any investment or trading decisions. Visit sebi.gov.in for a list of registered advisers.